What Is a Fishbone Diagram? | Templates & Examples
A fishbone diagram is a graphical tool used to find the main problems and identify possible solutions. It is also known as:
- Ishikawa Diagram
- Cause And Effect Diagram
- The Herringbone Diagram
This diagram is a tool for analysis and mapping out the major issues and the sub-causes leading to a specific effect or issue.
In this blog post, we will trace the history and provide templates and examples, and give you a better idea about the concept of fishbone.
Well, apart from the fishbone, you can also get rid of your assignment worries with the help of our reliable assignment writing services.
What is a Fish Diagram?
A Fishbone Diagram is a graphic representation that helps in identifying the major reasons of an issue. Its shape mirrors that of a fish skeleton. Where the problem statement is placed at the "head" and causes are organized into broad categories along the "bones."
Important Characteristics:
- Problem-centered: It revolves around a particular issue.
- Categorical: Causes are divided into rational categories to facilitate analysis.
- Collaborative: Typically generated during brainstorming sessions with cross-functional groups.
- Visual: The diagram clearly indicates the way various causes are related to each other.
A Brief Historical Overview of the Fishbone Diagram
Kaoru Ishikawa designed the Fishbone diagram tool to address the problems he faced at his ship in the 1960s.
Following this invention, the concept picked up fast. As a matter of fact, the popular car Mazda Miata was able to overcome problems through the use of the fishbone diagram.
Why Use a Fishbone Diagram?
A Fishbone Diagram is more than just creating a list of causes. It promotes critical thinking and teamwork that results in profound insights. Here's why it's worth using:
- Identifies Root Causes: Instead of addressing symptoms, it assists in finding root issues.
- Encourages Teamwork: Allows team members to work together in collaborative discussions.
- Improves Understanding: Provides a graphical picture that facilitates understanding of complex problems.
- Enhances Quality: Supports the creation of effective corrective measures, enhancing processes and products.
Structure of a Fishbone Diagram
A standard Fishbone Diagram contains the following elements:
Problem Statement (Head of the Fish)
This is the effect or problem you want to solve. It's written out on the right-hand side of the diagram.
Main Categories (Bones)
Causes are organized into principal categories. Typical categories are:
- People: Human factors like staff training or communication.
- Process (or Methods): Processes and routines.
- Equipment (or Machines): Machines and technology employed.
- Materials: Raw materials or inputs used.
- Environment: Physical, social, or economic surroundings.
- Measurement: Measurement methods and monitoring.
These categories can be different based on the industry or issue.
Contributing Causes (Smaller Bones)
Each one of these has branches of more detailed causes. The team has thought of these and included them in the diagram.
Fishbone Analysis: How to Draw a Fishbone Diagram
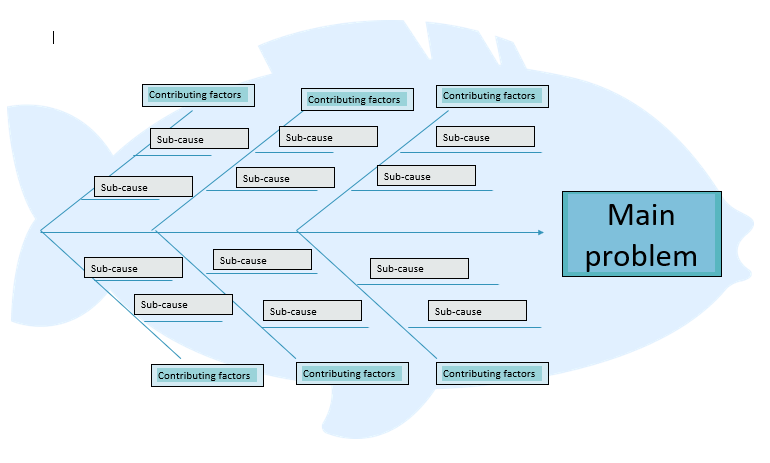
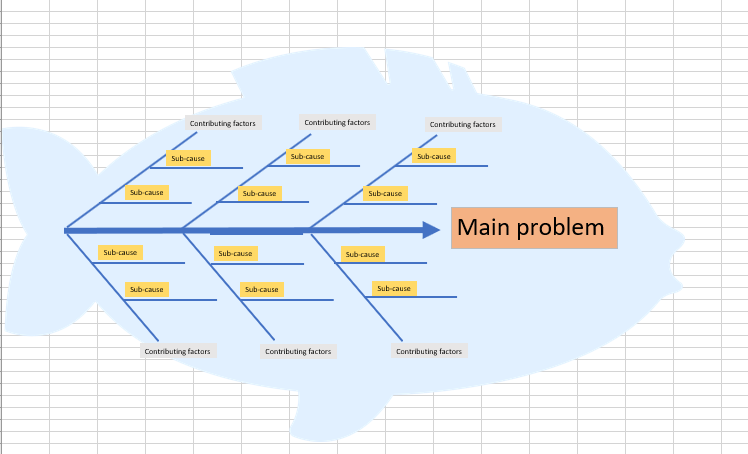
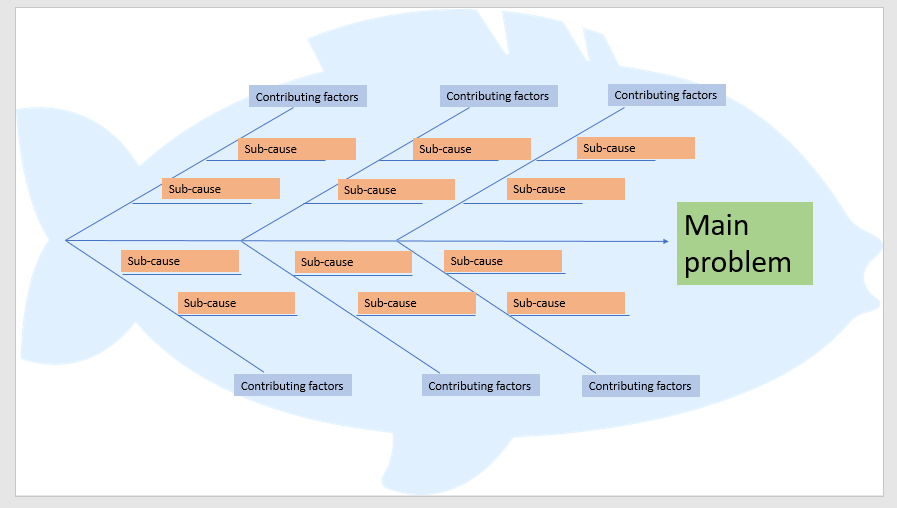
There are various ways of drawing a fishbone. But drawing it is quite simple and you can even use templates to create it on an online medium like Word or Excel.
The following are a few steps that you must take to create a fishbone diagram.
- Begin your diagram with the primary problem from the upper part of the fish.
- Then draw a long arrow or the backbone of the fish.
- Then draw lines branching off the backbone, known as the problem categories.
- Note the specific causes within each bone.
- Once you are finished, your fishbone will provide the details of the problems and the potential issues.
Various Templates of the Fishbone Diagram
You can search for various templates for Word, Excel, and PowerPoint. We have provided some templates below, so you can understand them better.
Fishbone Template For Words

Fishbone Template for Excel

Fishbone Template For PowerPoint

Advantages of the Fishbone Diagram
There are numerous benefits of working with the Fishbone diagram.
Visualisation
The fishbone diagram is a visual aid that can assist in helping you to sort your thoughts or issues that you would not traditionally think of. By getting everything down visually, in a connected order, you will be able to comprehend the source of the problem.
Easy to Understand
A fishbone diagram simplifies the understanding of the problem by individuals with no technical background.
Facilitates Teamwork
It enables individuals to think and brainstorm the core problem and potential solutions in the group meetings, not alone.
Logical Structures of the Causes
With fishbone diagrams, you can structure the causes logically and in categories such as 5Ms and 4 Ss.
Fishbone Diagram Example
Example 1: Manufacturing – Defective Product
Problem: Too many defective units rolling off the assembly line.
Categories:
- Man: Poor training, fatigue
- Machine: Dull tools, incorrect calibration
- Method: Irregular assembly procedure
- Material: Inferior raw materials
- Measurement: Faulty quality inspections
- Environment: Dimly lit, humid
The diagram led to a determination of a mix of worn equipment and tired workers as the primary causes.
Example 2: Healthcare – Delayed Patient Discharge
Problem: The Patient discharge process is taking too long.
Categories:
- People: Communication gap among doctors and nurses
- Process: Incomplete record-keeping
- Technology: Discharge software lag
- Environment: Crammed wards
- Policies: Flawed approval chain
Outcome: By optimizing the approval chain and enhancing the discharge software, the hospital cut delays by 40%.
Example 3: Software Development – Project Delay
Problem: The Project was delivered late.
Categories:
- People: Unskilled developers, uncoordinated team
- Process: Flawed agile planning
- Technology: Flaky development tools
- Requirements: Frequent scope changes
- Testing: Poor QA
The team recognized that poor sprint planning and uncertain requirements were the root cause, resulting in better backlog grooming habits.
Best Practices for Applying Fishbone Diagrams
- Be Specific: Steer clear of broad categories such as "lack of time"; drill down to uncover what's behind time deficiencies.
- Use Data: Wherever possible, back up your brainstormed causes with real-world data.
- Encourage Diverse Input: Unique viewpoints tend to reveal unexplored causes.
- Iterate: Refine and update the diagram as additional information becomes known.
- Keep It Focused: Address one issue at a time for optimal clarity.
Conclusion
The Fishbone Diagram is an effective and adaptable instrument that streamlines difficult problem-solving by dissecting problems into their underlying causes. By categorizing possible causes into organized categories, groups are able to find subtle issues, get aligned on solutions, and take action with concrete steps to better processes.
No matter if you're running a product line, a clinic, or a software department, integrating Fishbone Diagrams into your operation can bring more efficient decision-making and improved results.
And when it comes to academic life, getting UK dissertation writing service becomes crucial. Hire our reliable essay writing service UK and thesis writing service UK for scoring great and impressive marks in the exams.


